Understanding Your Hearing Test

What is an Audiogram ?

An audiogram is a critical component of your hearing test that helps us understand your ear health. A graph that can diagnose the type of hearing loss you have, as well as the severity of your hearing loss. It can differentiate your hearing in each ear and determine if you have hearing loss on one or both sides.

Essentially, it’s a visual depiction of your hearing. As you hear different frequencies, it illustrates how it compares to the normal hearing range. Hearing threshold levels are the lowest level of sound at which the human ear can detect a tone or sound at least 50% of the time.

A Hearing professional will generate your audiogram using several easy tests as part of your comprehensive hearing test.

The results of an audiogram can reveal, for instance, that a person has high-frequency hearing loss, which can assist explain why they have difficulty hearing high-frequency noises such as children’s voices or the phone ringing.

Image credits:
http://alphaonenow.com/userfiles/image/aud_audiogram.gif
http://baasnotes.com/blog/wp-content/uploads/2008/10/audiogram-presbyacusis-rgb.jpg

Audiogram Audiogram

During a hearing test, sounds at various frequencies are played at progressively lower volumes to assess the acuity of each ear. When testing with earphones or loudspeakers, the sounds go into the ear canal, through the middle ear to reach the inner ear. This is known as Air conduction testing or Pure Tone Audiometry. Air conduction testing looks at how the whole hearing system responds to sound.

If air conduction testing shows a hearing loss, the cochlea can also be tested in isolation with a Bone conduction test.​ A device called a bone conductor is placed behind the ear to send sounds directly to the inner ear. Sounds are sent through the bones of the head and do not pass through the eardrum or the middle ear. It is a crucial component of the evaluation as it determines and reveal any inner ear issues.

When the person responds to a sound at the lowest intensity at which they can hear a frequency, the test administrator will record these points (pitch). This number represents your threshold level.

To be clear, the audiogram only assesses the ability to hear in quiet, not the quality of hearing noise or hearing speech in noise.

An audiogram may not disclose information about your speech recognition ability, therefore, it’s critical that you speak with a hearing health specialist about it. All of these are easy hearing exams that are performed as part of the comprehensive hearing test that Hearing Buddy offers.

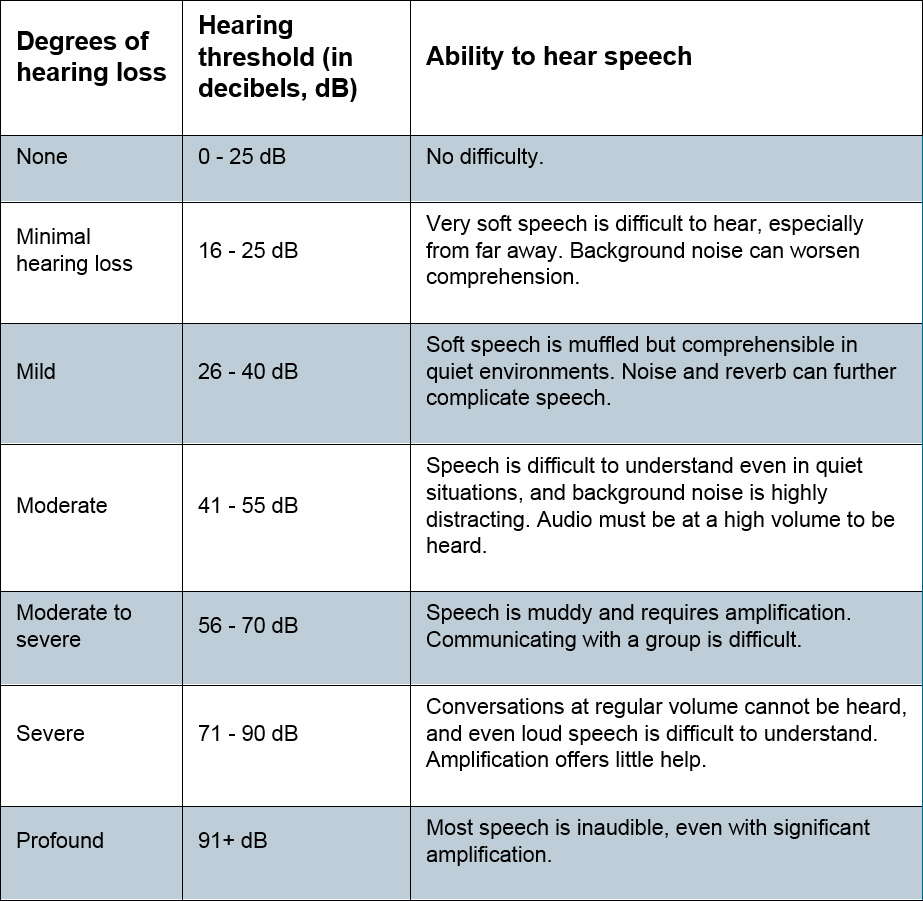
The amount (or degree) of hearing loss a person experiences is based on hearing sensitivity. In order to determine a person’s degree of hearing loss, their hearing thresholds must be determined. Hearing thresholds are defined as the lowest level sound that can be heard 50% of the time. The decibel (or dB) is the unit of intensity used to describe hearing sensitivity. During a diagnostic hearing evaluation, the threshold is measured at different frequencies (or Hertz, Hz) in each ear.

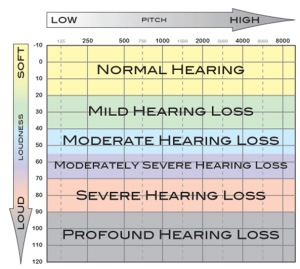
The audiogram is divided into two halves by two axes.

Vertical Axis

The Y-axis (vertical) measures the intensity, or loudness, of the sound. It’s measured in decibels (Db) and range from -10 to 110 on the audiogram.

In context, 30dB is approximately the volume of whispering, 60dB is around the level of a normal conversational sound, 80dB is approximately the level of heavy traffic, and 140dB is approximately the level of a really loud sound (such as a gunshot or jackhammers).

On the graph, the lowest values are at the top and the highest at the base. Normal hearing humans can hear sounds below zero decibels (dB), where the graph starts. Adults with hearing ranges of 0 to 20 dB are considered normal.

What we’re looking for is hearing loss that falls below this level of measurement.

Horizontal Axis

The horizontal axis, on the other hand, shows the frequency and pitch of a tone. Hertz (Hz) is a unit of frequency measurement that expresses the number of vibrations per second that make up a sound wave.

It’s important to keep this in mind when looking at your audiogram: as you move further to one side, the frequency gets higher. It’s similar to how piano keys work: the lowest pitch is on the left, and it rises in pitch as you move right.

A normal ear should be able to hear frequencies as low as 20 Hz and as high as 20,000 Hz with ease. However, the majority of speech sounds occur between 250 and 8,000 Hz, which is the frequency range most commonly tested for.

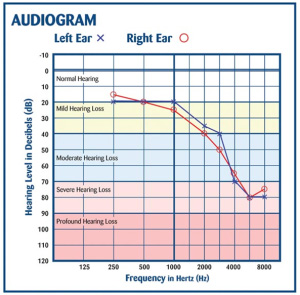
The audiogram will display the threshold levels for each ear. This line represents your hearing capacity in terms of volume and frequency.

A red “O” indicates a right ear response, whereas a blue “X” indicates a left ear response. A red line connects the “O”s, while a blue line connects the “X”s shows hearing levels in the left ear measured with headphones (air conduction).

< or [ is the result from your right ear as measured by bone conduction

> or ] is the result from your left ear as measured by bone conduction.

When something stops sounds from moving through the eardrum and middle ear, bone conduction hearing levels will be better than air conduction levels. This means a conductive hearing loss is present.

When sound moves normally through the outer and middle ear, but the inner ear does not work normally, both bone conduction and air conduction hearing levels will be the same. A sensorineural hearing loss is present.

The degree of hearing loss is expressed by the difference between a person’s threshold and the average threshold for people with normal sensitivity. ­­­The list below outlines different hearing loss thresholds as they are determined in relation to an individual with a normal hearing threshold.

levels of hearing ability

Need more details ?

Learn more about how the ear works and types of hearing loss.